An unofficial blog that watches Google's attempts to move your operating system online since 2005. Not affiliated with Google.

Send your tips to gostips@gmail.com.
Showing posts with label Google Analytics. Show all posts

October 10, 2013

Real-Time Site Search Visualization

If you like the full-screen Google Trends visualization that shows the latest hot searches, there's a cool project that uses the same animations to show Google Analytics searches in real time. It's made possible by the recently launched Google Analytics Real Time Reporting API and it shows your site's internal searches, as well as some of the Google searches that lead to your site.


"You can setup your own site visualization in only two steps: first authorize access to your Analytics data, select your site, and set the query parameter for your site searches, usually the letter q. Click save, and see your visitor's searches appear live as a beautiful visualization," explains Yvo Schaap, who developed the service.

Here's a video that shows how to use this addictive mashup:


According to the site, Live Site Search Visualisation is "a dashboard visualizing live search activity on your site using your existing Google Analytics tracking." It also shows Google search referrals. Just like in Google Trends, you can click the top-left corner to select the number of keywords that are displayed at a time.


Just in case you're worrying about this, the site does not "save any data coming from your Google Analytics account on its servers. All data requests are made client-side only over https."

{ Thanks, Yvo. }

October 14, 2011

Google Analytics in Real-Time

Two weeks ago, Google Analytics launched real-time stats. This feature is not enabled for everyone yet, but you can request an invitation using this form. After receiving the invitation, you need to switch to the new Analytics interface, select a site, go to the "Home" tab and click "Real-Time (Beta) / Overview".

I must say that this feature is addictive because it shows a lot of information about your site in real-time. You can find the number of active visitors, the number of pageviews, the top referrals and the top active pages. There's also a map that highlights the cities where your visitors are coming from. And all this information is updated so frequently that it's difficult to keep up with the ever changing stats.


Google Analytics is great for the intuitive reports and the advanced filters that help you understand traffic fluctuations, but a lot of people will use the service more often because of the real-time stats. They're constantly changing, they're mesmerizing and empowering.

August 18, 2010

Picasa Web Stats in Google Analytics

Picasa Web Albums has an option that lets you see detailed visitor stats for your photos. If you go to the Settings page, you can enable "photo tracking". The only thing you need is a Google analytics tracking code.


Picasa Web's help center explains that you need to create a new Google Analytics account (not a new Google account) to monitor Picasa Web Albums photo traffic. After creating the new account, find the account ID that looks like UA-xxxxxxx-y and enter it in the Google Analytics tracking code box from Picasa Web Albums. "Once the setup is complete, just sign in to Google Analytics and click View reports to see visitor stats for your photos. It can take up to 24 hours for Analytics to detect your tracking code."

A similar option is available for Google Docs, but only for published documents. While this feature is useful, it's not very easy to use and it's not properly integrated with Google Docs and Picasa Web. Showing simple stats, like the number of views, the top search queries and referring websites, in a special section of Google Docs and Picasa Web would be a much better idea.

May 25, 2010

Add-ons for Disabling Google Analytics Tracking

Google released plug-ins for Internet Explorer 7+, Firefox 3.5+ and Chrome 4+ that disable Google Analytics tracking. Google Analytics is by far the most popular free service for getting statistics about the visitors of a site and it's used by a lot of sites, including this blog. Even if the service doesn't show personal information about the visitors and it only provides aggregated data, some people are concerned that Google can track the sites they visit using a seemingly innocuous Google Analytics script.

Google explains that Google Analytics uses first-party cookies to track visitor interactions, so the data can't be aggregated for all the domains. "The Google Analytics Terms of Service, which all analytics customers must adhere to, prohibits the tracking or collection of [personal] information using Google Analytics or associating personal information with web analytics information."

Those that are concerned about their privacy can install an add-on and permanently disable the script. After installing the add-on, you'll notice that the browser still sends a request for this file: http://www.google-analytics.com/ga.js when visiting a page that uses Google Analytics, but it no longer sends information to Google Analytics.


If a lot of users install the add-on, website owners will no longer have accurate stats, they'll no longer be able to find if their content is popular and what sections of their site still need some work. Even if Google didn't release opt-out add-ons, users could still block Google Analytics by adding an entry to the HOSTS file, but the add-ons make it easier to opt-out.

Google also added a feature for website owners: Google Analytics can now hide the last octet of the IP address before storing it. "Google Analytics uses the IP address of website visitors to provide general geographic reporting. Website owners can now choose to have Google Analytics store and use only a portion of this IP address for geographic reports. Keep in mind, that using this functionality will somewhat reduce the accuracy of geographic data in your Analytics reports. "

December 1, 2009

Optimized Google Analytics Code

A lot of web sites use Google Analytics to analyze traffic data, so the performance of Google's tracking code is very important. Google recommends to place the code just before closing the <body> tag to ensure "that the tracking code is executed as the last element of the DOM". Otherwise, the script would block the other elements from loading and visitors would have until the script is executed to see the rest of the page. Unfortunately, you can't place the script at the bottom of the page if you some advanced features like tracking events.

To improve the script's performance, Google decided to load it asynchronously. "Unlike a traditional installation, asynchronous tracking optimizes how browsers load ga.js so its impact on user experience is minimized. It also allows you to put your Analytics snippet higher in the page without delaying subsequent content from rendering."

Here's the new code for basic tracking, which uses some ideas from Steve Souders:

<script type="text/javascript">

  var _gaq = _gaq || [];
  _gaq.push(['_setAccount', 'UA-XXXXX-X']);
  _gaq.push(['_trackPageview']);

  (function() {
    var ga = document.createElement('script');
    ga.src = ('https:' == document.location.protocol ? 
'https://ssl' : 'http://www') + '.google-analytics.com/ga.js';
    ga.setAttribute('async', 'true');
    document.documentElement.firstChild.appendChild(ga);
  })();

</script>
Google Analytics Blog says that the new snippet is a beta feature and changing the code is optional.
The new tracking snippet offers the following benefits:

* Faster tracking code load times for your web pages due to improved browser execution
* Enhanced data collection and accuracy
* Elimination of tracking errors from dependencies when the JavaScript hasn't fully loaded

April 29, 2009

AdSense Reports in Google Analytics

The integration between Google Analytics and Google AdSense is a significant upgrade for AdSense's limited reports. Until now, AdSense didn't offer reports for individual pages and users had to manually create custom channels to track the performance for up to 200 pages.

The AdSense section from Google Analytics includes a lot of new information: the list of pages that bring the most important revenue, the most profitable referrers and you can find even more by creating custom segments.

Here are some things I was able to find from the reports:

* 63% of this month's revenue was from visitors who use IE, even if only 38.42% of the visits were from Internet Explorer users.


* 6.18% of the revenue was from Mac users, even if 10.24% of the visits were from Mac users.


* the visitors that come from Google Search click on the ads less than those that come from Yahoo Search and Live Search.


* new visitors are more likely to click on ads than returning visitors.


Google Analytics blog has more details about the integration and the way you can link your AdSense account with Google Analytics.

April 21, 2009

API for Google Analytics

One of the few missing features from Google Analytics was the ability to access data programmatically. Now you can create application that use data from Google Analytics using the Data Export API.

"With the Google Analytics Data Export API, you can develop client applications that download Analytics data in the form of Google Data API feeds. Your client application can use the Data Export API to request data from an existing Analytics profile for an authorized user, and refine the results of the request using query parameters. Currently, the Data Export API supports read-only access to your Google Analytics data."

The API is useful to create different interfaces for Google Analytics and to process the data in interesting ways. For example, you might build a notifier that alerts you when your site has a large number of visitors or you could use the data to display a list of popular posts from your blog.

There are already some interesting applications that use the API, including a dashboard that integrates data from Google Analytics, a SEO tool that analyzes the keywords used to find the site, a mobile interface for Google Analytics and an AIR application.


"The Data Export API is easy to use and provides read-only access to all your Analytics data. Any data that's available through the standard Analytics web interface is available through the API. The Analytics API is a Google Data API. This is the same API protocol for Google Calendar, Finance and Webmaster Tools," mentions the Analytics blog.

If you don't think this news is very exciting, you should become a trusted tester for Google Analytics to try other cool features before they're publicly available. "Current Trusted Testers have recently tried out such features as: Event Tracking, Data Sharing, and Outbound Links."

September 4, 2008

Google Analytics Tracks Chrome

TechCrunch reports that Google Analytics included Chrome in the list of detected browsers. It's probably irrelevant that 8.64% of today's visits for this blog were from Google Chrome because a lot of users test the new browser to see if it's better than IE, Firefox, Safari or Opera.

(Find the report in : Visitors > Browser Capabilities > Browsers)

Two days ago, Google Analytics Blog admitted that the web analytics service intentionally concealed the identity of the new browser. "Because Google Chrome was not launched externally until today, we haven't yet changed Google Analytics to recognize it when you segment by browser within reports. However - this will change in the coming weeks (until then, the browser will show as Firefox)." The blog post has been edited and it no longer contains the reference to Firefox, but I can't help wondering if Google Analytics hides other things.

If you want to detect Google Chrome, this user-agent should be helpful:

Mozilla/5.0 (Windows; U; Windows NT 6.0; en-US) AppleWebKit/XX (KHTML, like Gecko) Chrome/YY Safari/XX

For now, most services don't detect Chrome, probably because Safari has a very similar user-agent:

Mozilla/5.0 (Windows; U; Windows NT 6.0; en-US) AppleWebKit/XX (KHTML, like Gecko) Version/ZZ Safari/YY

July 1, 2008

Google Docs Stats

Update (March 2012): This feature is no longer available. "We're phasing out Google Analytics support in our new editors, but we'll be working on alternatives to provide admins with more information about their doc's viewers."

If you publish documents at Google Docs and link them from web pages, you may wonder how many people actually view them. Google helps you find this information by placing a Google Analytics tracking code that can be connected to your account.

How to get traffic stats for your documents?

Just go to Google Analytics, create a new profile for http://docs.google.com and get the tracking code for that profile. You only need a small piece of the tracking code: the value displayed in bold below, which should be different for your account.

var pageTracker = _gat._getTracker("UA-84813-6")

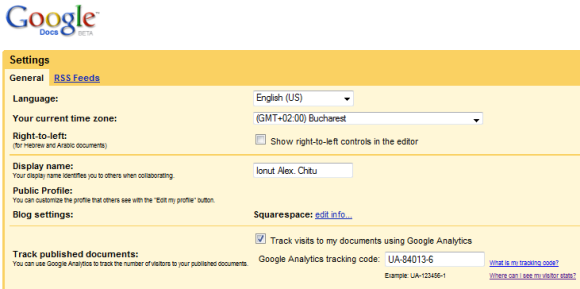
Once you have that value, go to Google Docs Settings, enable "Track visits to my documents using Google Analytics" and paste the value in the input box for "Google Analytics tracking code".


What happens after enabling the integration with Google Analytics?

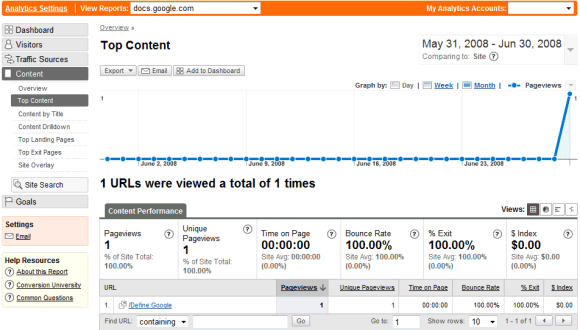
After a couple of hours, you should see some traffic data in your Analytics account:


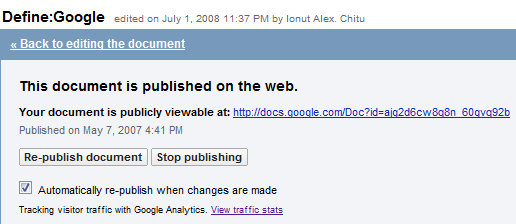
You'll also find a confirmation that the visitor traffic is tracked with Google Analytics after you publish a document:


The list of Google services that integrate with Google Analytics includes: Google Sites, Project Hosting, iGoogle gadgets and hopefully the support will be extended to other services.

{ via Blogoscoped Forum }

April 30, 2008

Google Analytics for Blogs


Two years ago, Google bought Measure Map, a very intuitive analytics software for blogs designed by Jeffrey Veen. Since then, Google Analytics borrowed some elements from Measure Map's interface. It seems that the transition is about to end soon as Google Analytics will integrate Measure Map's functionality: blog stats.

Measure Map users received an email that instructed them how to access the new version of the software.
Convert your Measure Map account to Google Analytics

We're giving our earliest users of Measure Map an opportunity to use our new service, built on the powerful Google Analytics platform and continuing to use the interface you're familiar with.

1) Create an account at Google Analytics.

2) Install the Google Analytics tracking code on your blog.

3) Tell us the URL of the blog you're using. (Option: This is a Blogger blog. If so, we'll put a "Stats" tab on your Blogger dashboard.)

It's clear that the standalone Measure Map is history and all of its features will be added in a new Google Analytics section for blogs with information about comments, links from other blogs, popular posts and, hopefully, real-time stats. FeedBurner is also a good candidate for integrating with Google Analytics and providing the big picture of your blog's traffic.

Another good news is that Blogger users will finally have a stats panel that can be accessed directly from Blogger's interface. Hopefully, Google will also include options like showing the number of views for each post or adding a list of the most popular posts in the sidebar.


{ The first image is licensed as Creative Commons by Andy Zeigert. }

Update. Google sent this:
Recently at South by Southwest, we announced our new Google Analytics for Blogger reporting interface. This integration marks the transition of Measure Map users worldwide to a new Google Analytics interface specifically designed for Blogger users. We've rebuilt Measure Map as an integrated feature of both Google Analytics and Blogger, which will give bloggers daily stats such as the number of visitors they receive, how many posts get traffic, and new referring links. Users can also use Google Analytics, of course, to track their blogs. More information is available on our Help Center.

We'll be refining the new interface in the coming months before we release it to the general public, and we're excited to help bloggers further understand the impact they're having on their readers.

Update 2: Google Analytics Blog has a screenshot of the Blogger integration. Google says it "will support all blogging programs. Bloggers who don't use Blogger will see a new reporting interface that resembles Google Analytics."

April 3, 2008

New Google Analytics Charts Show Time Patterns

Google Analytics added a new option for charts: graph data by hour, day, week or month. The hour graphs are only available in some of the visitors reports and they could be helpful to find out the time of the day when most people visit your sites. The graph below shows a strange shift that happened in the past year, even if the regional distribution of this blog's visitors hasn't changed too much.


It would be nice to see aggregated graph for days of the week, for months and for years, enhanced with some possible explanations for the changes, like we can see in Google Trends and Google Finance.

{ Thanks, Fede777. }

March 21, 2008

Google Analytics Benchmarks

Two weeks ago, Google Analytics added a new feature that lets you compare your site's traffic with average data for other similar sites. To make this feature possible, you need to enable data sharing with the benchmarking service. "Google will remove all identifiable information about your website, then combine that data with hundreds of other anonymous sites in comparable industries and report them in an aggregate form." There's also an option to enable data sharing with other Google services that will allow a better integration between Analytics, AdWords and other services.


The benchmarking data is now live and you can see it if you go to Visitors > Benchmarking (Beta). Google compares the following values for the last 30 days: visits, page views, pages/visit, bounce rate, average time on site and new visits. By default, your site is compared with other sites of similar size, but you can restrict the benchmark to general categories like: Internet, Travel, Shopping, Reference etc. Since the data is aggregated from the sites that agreed to participate in the program, it may not be representative. Google says it will add new categories once more sites will enable the data sharing option.

"When benchmarking is enabled, Google crawls the websites in the account then categorizes them by vertical and the amount of visits. The data is then made anonymous through aggregation. For sites of a similar size, a category of industry verticals can be chosen when there is a sufficient number of accounts in that category."


It's interesting to compare your site's traffic with these aggregate data as it will help you put things in perspective, but you shouldn't be disappointed if the comparison is not favorable. Each site is unique and has a different raison d'être.

March 13, 2008

Traffic Stats for Your Google Documents

My wish to have traffic stats for user generated content hosted by Google is partly fulfilled. Google Docs has a new option to track published documents using Google Analytics. You need to go to the Settings page, enable the tracking option and add a Google Analytics profile ID. It's not clear whether you need to create a new profile or use an existing one, but both options might work.


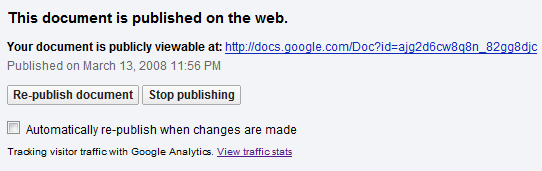
After publishing a document, you'll see a small message: "Tracking visitor traffic with Google Analytics."


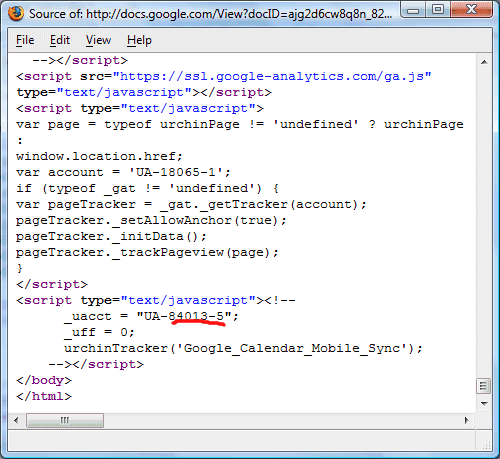
The screenshot below shows the source code of a published document: the first Google Analytics tracking code is used by Google, while the second tracking code is associated with your account.


The other hosted Google service that allows you to add Google Analytics code is Project Hosting. It's also easy to add the tracking code if you develop iGoogle gadgets.

{ via Blogoscoped Forum }

Update: The option is no longer available in the settings, but even when it was available you couldn't use it because the Analytics code was broken. Hopefully, Google will fix the problem soon.

October 22, 2007

Traffic Analysis for Content Hosted by Google


Google Analytics is useful to find information about your site's traffic, but it would be even more useful to gather stats for other sites you use to post your content online. For example, you might post videos on YouTube, upload photos to Picasa Web Albums and create documents using Google Docs. It would be interesting to link these services with Google Analytics and get access to a wealth of information about the number of views for each item, the time spent on a page, the referrals and more.

Google already does this for Project Hosting: "To provide the most useful software to your users, you might want to know simply how many potential users have visited your project workspace, which countries they come from, which browsers they use, and which of your wiki pages they have viewed. Now all those questions can be answered. Project owners may simply sign up for Google Analytics and enter an analytics profile number into the project admin page. Tracking data can be viewed on the Google Analytics site about 24 hours later."

This could solve a lot of user requests and make these services more personal and more useful. Scribd, a document sharing service I mentioned earlier this year, shows a lot of traffic data publicly, but I'm not sure if that's the way to go.

June 13, 2007

Google Analytics Restores Missing Features

Google Analytics polished its offering by adding some small new features. Now you can actually click on the external pages from the reports, so you don't have to build the URLs from scratches.


The same reports let you see up to 500 rows, like in the previous version of Google Analytics, while the reports related to visitors restored the per-hour view.

Other updates include:
* It's now easier to add an AdWords account to an existing Google Analytics account.

* Bounce rates measurements have had their colors changed for visual consistency. A decrease in bounce rate is now colored green to match other positive changes, while an increase in bounce rate is colored red like other negative changes.

* Cross-segmenting by Network Location has been added to the standard list of segmentation options throughout the interface.

The new interface lets you see more information at a glance, but also drill down more effectively in the reports. It will be interesting to see if Google decides to release a new version targeted to blogs (that expands Measure Map and adds FeedBurner reports for feeds) or Google Analytics will integrate everything in a single package.

May 8, 2007

Google Analytics Relaunches With a Simplified Interface

The powerful but way-too-complicated Google Analytics was redesigned by the Measure Map team and has a cleaner look.

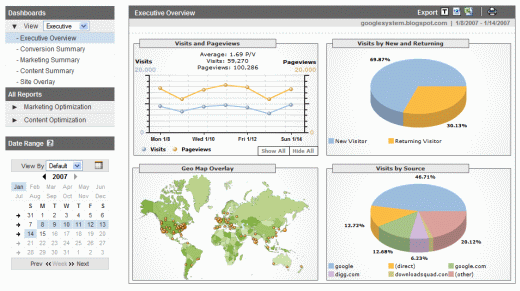
"With this new version, users can experience greater visibility of important data, clarity of appearance and more intuitive navigation paths. Utilizing more features and improved metrics, Google Analytics summarizes data and statistics in plain language so that website owners can make more informed decisions. The tool incorporates score cards and summaries that distill information into key performance indicator summaries," says Google in a press release. Other new features are emailing reports and PDF downloads.

The new version is available for some of the existing users and for those who sign up to Google Analytics starting today. For a sneak peek, check this video introduction and read a detailed post written by Avinash Kaushik.


{ The second screenshot is licensed as Creative Commons by vrypan. }

January 15, 2007

Interview with Brett Crosby, from Google Analytics

Stone Temple has an interview with Brett Crosby, co-founder of Urchin, the company behind Google Analytics. Brett explains that he and his team decided to focus on improving the product and to offer professional services through third parties.

What we have done is focused a lot of effort on making our products extremely easy to use, easy to set up, and we've tried to get rid of integration hassles wherever we can. For example, by pre-integrating with products like AdWords; and we've also done some stuff with Google Checkout. We hope to make these things a kind of one button "click and it works." That's the model we tend to go toward when we can.

I don't think Google Analytics is that easy to use, like Brett says. For example, it's not possible to get a complete list of your top referrals. If you go to "Referring source" you get a list of sites, and for each site you can see all the pages that sent you traffic. But there are no links and you have to manually build the URLs to be able to check that pages.

Instead of having an expensive product, like most of the rest of the market, we have a free product. Many analytics products come with a pre-determined set of professional services, and then if you want additional things the analytics vendor will up-sell you. For a lot of analytics vendors, professional services is a big piece of their revenue stream. Google has used a really different approach. It's a free product that anyone with a website can use.

It's a nice feeling to use the same product like a big corporation, even if you only have a small site. You'll also be happy using Google Groups or the online help.

Brett explains the reasons why web analytics tools report different numbers:
"(1) the first one is how you define unique visitors and
(2) how the analytics package handles the length of time between visits, and
(3) whether anti-spyware is blocking cookies for one vendor and not another."
One of the priorities for Google Analytics is to count traffic from users that disable cookies or JavaScript. They also want to handle AJAX applications better, as the page views are irrelevant.

Homework:
1) Is Google Analytics easy to use?
2) How would you improve it?

{ Via Search Engine Watch. }

August 16, 2006

More Google Services Available

More Google services will be available for everyone. You don't need invitation from Google to test them, and you don't need to try a testing version, like in Google Talk's case (see below).


Google Analytics, which is basically the former Urchin hosted on Google servers and delivered for free, is now available without invitation. You can see more information about the visitors of your site and analyze your performance. While Google Analytics had some problems that slowed your page loading and was even down for short periods, the service scalability has been improved. Google itself uses Analytics for most of its pages.


Google Spreadsheets, the service that allows you to create spreadsheets online and edit them collaborating with other people, is now a public beta. Although the spreadsheets have limitations and you can't add charts or macros yet, it's an interesting application, not intended to replace Excel.


The latest version of Google Talk, that includes support for file transfer and voicemail, will be released today, at Google Talk's 1 year anniversary. Although the client is not yet mature and it lacks basic VoIP features and a rich-text editor, the clean interface is a big advantage in the future developments. When Gmail will be out of beta (which is not that far away), the userbase will increase and the biggest problem of any messenger client (I don't use it because my friends / co-workers don't use it) will be solved.

August 2, 2006

Matt Cutts Answers SEO Questions

Google's interface with webmasters, Matt Cutts, answers more questions on Google Video.

Some of the questions:
Google terminology - What's the difference between an index update, an algorithm update, and a data refresh?

Static vs. Dynamic urls: does PageRank flow the same to both?

Does Google Analytics play a part in ranking web pages? [ Short answer: no. ]

Should I worry about results estimates for 1) supplemental results 2) using the site operator 3) with negated terms and 4) special syntax such as intitle? [ Short answer: no. ]

Which is more important: search engine optimization (SEO) or end user optimization? [ Short answer: both should be the same kind of optimization. ]

One of the best pieces of advice to follow is not to design a site with search engines in mind, because search engines are not your visitors (they crawl your site), they change the algorithms often and their main aim is to have great results for the users. So if you design a site with the user in mind, you'll know that even if a search engine penalizes you for a while, it will change its mind soon. So everytime you make a change to your site, ask this question: will it help the visitors?

Update: some partial transcripts are available at Google Blogoscoped (transcript 1, transcript 2).

May 1, 2006

Google Analytics Hack: Edit Your Stats

Google Analytics has an easter egg: most labels from the reports can be edited. You can't modify the graphs or the numbers, but you can produce fake statistics that show your site was both digged and slashdotted in the same week. The links from the chart are real, but are somehow verbose.

For a video that shows this feature, check Google Blogoscoped.