"The goal of Fusion Tables, as with other database systems, is to manage larger amounts of data than spreadsheets typically do. This size difference leads to a focus on a different set of functionalities. For example, Fusion Tables focuses more on bulk operations on the data (filtering, aggregation, merges). These operations are typically not necessary for smaller collections of data stored in spreadsheets. In contrast, spreadsheets preserve complete flexibility in managing data -- you can put any value you want in any cell and work carefully to format your spreadsheet to make it look nice," explains the FAQ.
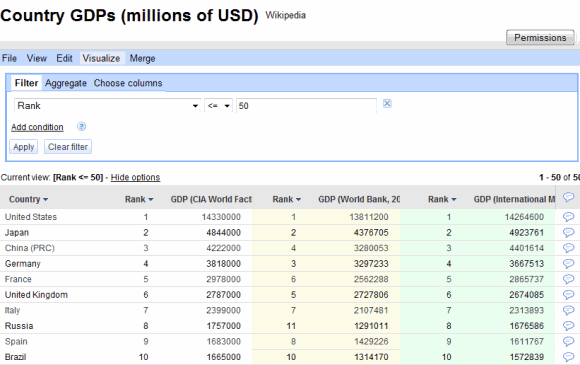
You can import spreadsheets from your computer, select one from Google Spreadsheets or open a table from the gallery.
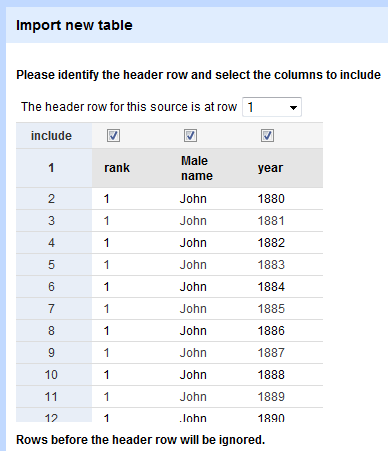
One of the samples, titled "Popular Baby Names -- 1880 to 2008", has 129,000 rows, but Fusion Tables displays 100 rows at a time. To manage a such a large amount of data, you can apply filters, show aggregates, create views that only include some of the columns.
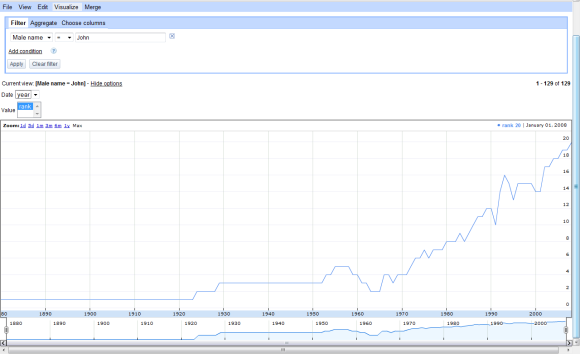
There are many options to visualize the data: on a map or intensity map, using lines, bars, pies, scatter plots, motion charts or on a timeline. For example, you can visualize the popularity of the name "John" in the US, which has slowly declined since 1924.
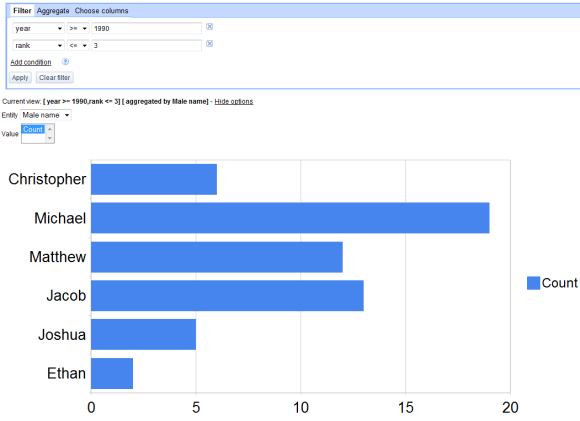
To see which are the most popular male names in the US since 1990, I added two filters: year >= 1990,rank <= 3 and then I aggregated the data by male name. The bar chart shows that Michael is the most popular male name.
The service has rough edges and there aren't many options to perform computations: there's no support for SQL or GQL queries, the sorting options are limited and you can't add data using forms.
Even if it's just a pre-alpha version, Fusion Tables has built-in collaboration features: you can invite people as viewers, contributors (they are allowed to add columns, but not to edit the existing columns), collaborators or owners. Anyone who is invited can add comments to a cell or a column.
{ Thanks, Surendra. }

Currently Google Fusion Tables appears to fail. Both for people trying to opload spreadsheets from their computer as well those trying to use the spreadsheets in their Google Docs account.
ReplyDeleteIMHO the lab doors were opened a bit too soon for this application...
Good this be the future Google Spreadsheets? This week Google said that big updates were going to happen for docs this year.
ReplyDeleteGlad to know that Google is now helping to optimize large data sets of tables.
ReplyDeleteThanks
Sankar
Did you notice the new domain name: googlelabs.com (well new to me at least, maybe old but this was the first time I noticed it).
ReplyDeleteI like how there are two smart, well funded, aggressive entities both solving this problem...
ReplyDeletehttp://aws.amazon.com/publicdatasets/
We only need one read-only copy of these data - those who can make them available with the most ubiquity and least friction to developers will dominate ...and either way we'll benefit.
Well managing databases is usually a tedious task..but google ahs made it easier for us now..Creating fusion tables in google is really easy way to manage databases..
ReplyDeleteGoogle is really amazing fusion tables are new feature of google.Fusion tables mange large amount os data very easily.
ReplyDeleteIt is good to see that Google is finally entering the Data Visualization and Infographics space with Google Fusion. Data visualization is currently not available in the Google Apps platform. There are some 3rd party Google Docs gadgets for creating TreeMaps, Timelines, Pivot Tables, Maps and such, but nothing that is officially supported by Google.
ReplyDeleteThere are many players in the consumer data visualization space – IBM Many Eyes, Chartle, Timetric, dabbledb, Microsoft Research Excel add-ins and others, but IBM Many Eyes is the best thus far. You can create amazing visualization with Many Eyes.
In time, I am sure Google will be a strong contender in this technology space, but they have a long way to go.
Does Fusion tables can manage big database ?
ReplyDelete