Now you no longer need to use
Wolfram Alpha to plot Math graphs. Google
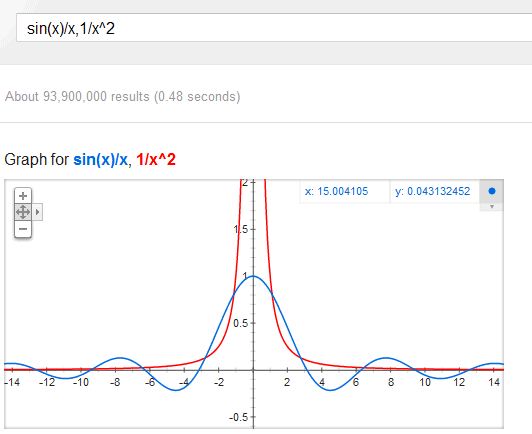
shows an interactive graph when you search for a Math function or a list of functions separated by commas. "You can zoom in and out and pan across the plane to explore the function in more detail. This feature covers an extensive range of single variable functions including trigonometric, exponential, logarithmic and their compositions, and is available in modern browsers," explains Google.
For example, you can search for [
sin(x)/x, 1/x^2] to see this beautiful SVG graph.
You can also search for [
sin(x) from -pi to pi] or add extraneous words like "plot", "graph" to the query (example: [
graph ln(x)]).
{ Thanks,
Arpit. }

Awesome, how great (and fast) is this!
ReplyDeletewhy only 4 graphics?
ReplyDelete(sqrt(cos(x))*cos(200*x)+sqrt(abs(x))-0.7)*(4-x*x)^0.01, sqrt(9-x^2), -sqrt(9-x^2)
ReplyDeleteIs it possible to use polar coordinates?
ReplyDeleteπ isn't work
ReplyDeleteyour language neither isn't
Deleteyes it wasn't?
DeleteThis is great. Even better if it was possible to resize the widget that the graph is inside.
ReplyDelete"π isn't work"
ReplyDeleteJust use word 'pi'
I just tried to plot the batman insignia but it needs too many words/characters
ReplyDeleteWhat do I search for to get the last graph in the blogpost?
ReplyDeletesqrt(cos(x))*cos(200 x)+sqrt(abs(x))-0.7)*(4-x*x)^0.01, sqrt(9-x^2), -sqrt(9-x^2) from -4.5 to 4.5
Deletemeh, max() does not work
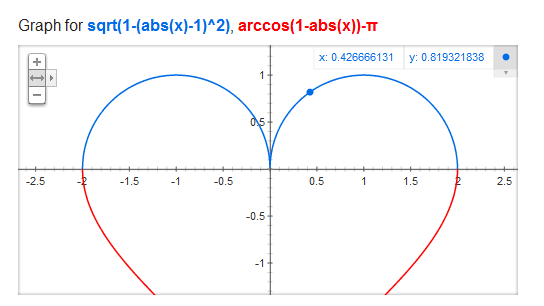
ReplyDeletePär, sqrt(1-(abs(x)-1)^2),arccos(1-abs(x))-pi
ReplyDeleteabs(x)-(1-x^2)^(1/2), abs(x)+(1-x^2)^(1/2), x+ 0.25 from -3 to 3
ReplyDeletehttp://goo.gl/KlFPi
i don't know how to use this!...do i need google chrome to get the graph?
ReplyDeleteIt works in the latest versions of Firefox, Chrome, Internet Explorer, Safari, but not in Opera. Most likely, it doesn't work in IE6, IE7, IE8 because these releases don't support SVG.
ReplyDeleteIt doesn't have to do with SVG support. It has to do with HTML5 support, therefore Firefox 4+, Chrome 6+, Safari 5+, and Internet Explorer 9+ support it.
DeleteHTML5 support is something vague and almost meaningless. Google uses SVG to plot the graph and SVG has nothing to do with HTML5. It's just a way to define vector graphics using XML.
DeleteJust because a browser implements certain SVG features, doesn't mean that Google will automatically support it. This feature works in Firefox 3.6, but not in Opera 11.5. If you change the user-agent and "mask as Firefox", you'll notice that the feature works well in Opera.
Decimals do not seem to work?!
ReplyDeletehttp://www.google.de/search?q=2.5*x%2C+x^3
Can somebody confirm?
Worked fine for me
Delete@Echt Einfach TV:
ReplyDeleteThey work for me.
Echt Einfach TV@ Why? http://imgur.com/lpDlJ
ReplyDelete@Alex Chitu + @Anonymous:
ReplyDeleteYou are right, it works. Thank you.
Amazing! Google is truly the most complete company there is, I can't even name anything that they haven't gotten into as of late. They are bound to surprise us with something new any time soon now.
ReplyDeleteGoogle, why all the hate towards Opera users? Seriously, Opera supports HTML5 or whatever you're using just fine, if you switch the setting in it on "Identify as Firefox" the plotting works flawlessly. Is it an elaborate plan to kick Opera off the market or just lazy and nearsighted developing/whielisting?
ReplyDeleteGoogle pretty much ignores Opera. The browser is not officially supported by almost all Google services and many new features don't work in Opera. Probably Google's developers don't bother testing the apps in Opera and making sure they work well, so they simply disable the new features in Opera. I remember that Google Instant wasn't available in Opera for more than a year. Opera's different rendering engine and the small number of users make Opera compatibility a low priority for Google. I think that's an unfortunate policy, but there's at least one Google service that has always worked perfectly in Opera: Google Reader.
ReplyDeleteThat's cause of different system used by Opera, that's not google's fault in fact ;)
DeleteYes it is!, Google and Firefox are partners all along, if you don't believe me Google it by yourself about who is the main contributor to the mozilla protect. anyway
DeleteThe thing is, they are fighting in together the Holy War of Browsers, and Opera happens to be the week link, if you realize is all true, 'cause they can't attack Internet Explorer just like that, by the simple fact they're to many users on that browser, the other is Safari, mainly from Apple's products, again they are to many Iphones and Ipads out there.
The world is at war, you might not realize it till you end up programming a simple web page...
I can't graph an inverse hyperbolic tangent.
ReplyDeleteTry it!
atanh(x)
arctanh(x)
tanh^-1(x)
Apart from that, Google is awesome.
That would be arctan(x)
Deletearctan is arc tangent. Not inverse hyperbolic tangent.
DeleteHowever, the calculator makes mistakes. Compare:
ReplyDelete10000.0*(-exp(-exp(-x)) + exp(-exp(-(x+0.0001)))
with
(-exp(-exp(-x)) + exp(-exp(-(x+0.0001)))*10000.0
Google is trying another time to rob another market segment, but the competition here is wolframalpha -- so there's really no competition (yet).
ReplyDeletethis will provide some entertainment for a while!
ReplyDeleteNo it dosn't make mistake. You made one. You are missing one clossing bracket in second function.
ReplyDeleteIt should be
(-exp(-exp(-x)) + exp(-exp(-(x+0.0001))))*10000.0
is there some way to set zoom?
ReplyDeleteNice filled heart:
ReplyDelete((sqrt(cos(x))*cos(500*x)+sqrt(abs(x))-0.4)*(4-x*x)^0.1
awesome!!!!!!!!!
ReplyDeletesqrt(cos(x))*cos(200 x)+sqrt(abs(x))-0.7)*(4-x*x)^0.01
ReplyDeletex^2
ReplyDeletesqrt cos x cos 200 x sqrt abs x 0.7 4-x x 0.01
ReplyDelete9GAG RULES!!!
ReplyDeleteLIKE A SIR!!!
Delete(sqrt(cos(x))*cos(200*x)+sqrt(abs(x))-0.3)*(4-x*x)^0.01, sqrt(9-x^2), -sqrt(9-x^2)
ReplyDelete(sqrt(cos(x))*cos(200*x)+sqrt(abs(x))-0.3)*(4-x*x)^0.01, sqrt(9-x^2), -sqrt(9-x^2)
ReplyDeleteI have 3 computers, one with ie6, one with ie8, one with ie9, and not one of them will display any graphs. Other folks have same issue. It works fine for me in FF. Can't find any help on this topic. Enabled java script, set security to minimal, tunred off malware monitoring, installed latest flash. Nothing will let it work in IE
ReplyDeleteIt should work in IE9.
DeleteWell, that means that you should stop using crappy browsers, like IE.
DeleteLOL another IE user complaining that the internet doesn't work.
DeleteIs there any way to plot a polar plot directly? (without manually converting to Cartesian coordinates)
ReplyDeleteAlso, how do you encode the zoom level in the URL? The heart example above cuts off the bottom of the heart unless you zoom out. :(
I found one way to keep the zoom levels -- just plot a few constant functions ahead of the main graphs, as in:
ReplyDeletehttps://www.google.com/search?q=graph+-2%2C+1%2C+0.5*sqrt%281-%28abs%28x%29-1%29%5E2%29%2C+0.5*%28arccos%281-abs%28x%29%29-pi%29
Why doesn't this work in Opera?
ReplyDeletesin(x/x)/x, -sin(x/x)/x
ReplyDeleteA cute red and blue sparkle
DeleteI was looking for something like this for a long time...
ReplyDeleteThis Graphing Calculator is AWESOME!!! =)
ReplyDelete11*x*log(x)*y*(y-1)+exp(-((25*x-25/e)^2+(25*y-25/2)^2)^3)/25 from 0 to 1
ReplyDeleteshort url: http://tinyurl.com/83q94w8
from ptt
Nice one :)
Delete5 + (-sqrt(1-x^2-(y-abs(x))^2))*cos(30*((1-x^2-(y-abs(x))^2))), x is from -1 to 1, y is from -1 to 1.5, z is from 1 to 6
ReplyDeleteNow this is something =)
somehow this is not working for me anymore. If I type "sin(x)" I won't get any graph at all... can anyone check if this is still working?
ReplyDeleteI'm using chrome windows 7.
thanks
I have the same problem... what happened?!?
DeleteWindows7 sucks, that's what happened. Use a real OS.
Deletenice tricks zones here...
ReplyDeleteabs(x+4)+abs(3-x) does not work
ReplyDeleteis there any way to plot a sinewave and then overplot discrete sample points at fixed period? Many thanks in advance.
ReplyDelete(x + y) * (x - y)
ReplyDelete