to generate the charts.
To obtain the URL, open the spreadsheet, click on "Publish" and then on "Publish now" and "More publishing options". Select the ATOM format and generate the URL. You'll need to copy the URL and introduce it here.
If you don't want to have a public spreadsheet, go to "Publish" again and click on "Stop publishing".
*Note: the site only looks at the first two columns, that need to have a header with two cells that contain "x" and "y" (here's an example of accepted spreadsheet).

If you're looking for an online spreadsheet with charting feature, you may take a look at EditGrid . In many ways, it's better than Google's one.
ReplyDeleteHere's a demo of it's charting capability in live.
Another site to make charts from Google spreadsheets data:
ReplyDeletehttp://www.chartAll.com
Example:
http://www.chartall.com/Charts/ViewSource.aspx?chartID=02d8f0c9-5d7c-42bd-861a-a26b1a3125ec
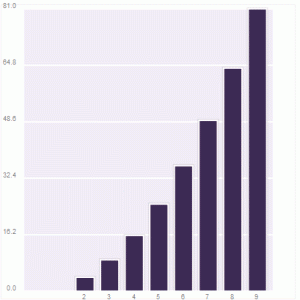
Image:
http://www.chartall.com/Charts/ShowChart.aspx?chart=02d8f0c9-5d7c-42bd-861a-a26b1a3125ec
It uses our www.teechart.com components as underlying charting engine.