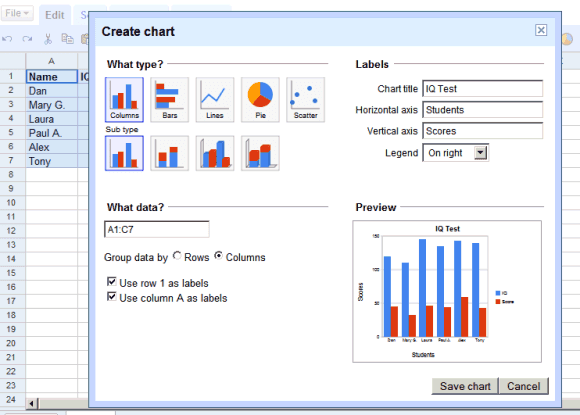
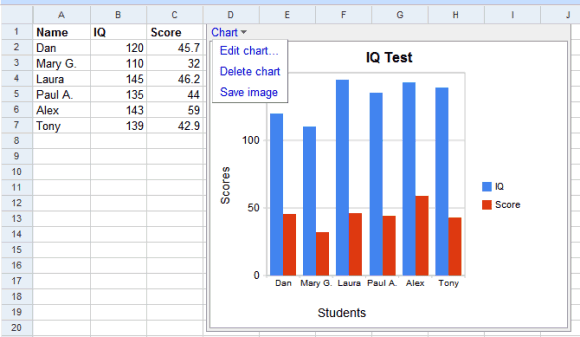
You can create more types of charts: columns, bars, lines, pie, scatter, add labels and a legend. Just select the columns you want to plot and click on the new chart icon. After inserting the chart in the spreadsheet, you can save it as a PNG image or edit it.
The charts are rendered as SVG in Firefox/Opera and VML in Internet Explorer, so they don't require plug-ins. As usually, Opera is not officially supported, so you'll find things that don't work as expected.
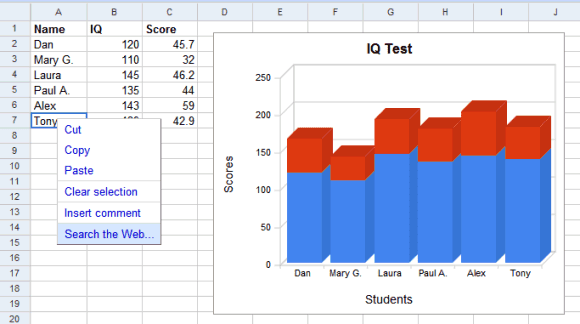
You can annotate cells and search using Google the text from a cell.

Great news!
ReplyDeleteI'm going to try now the new features! :D
They need to add auto-filter asap
ReplyDeleteyou're pretty smart :-)
ReplyDeleteShould've used something like ComponentArt's WebChart,
ReplyDeletehttp://www.componentart.com/webchartlite/default.aspx
Now those are some charts!
Nice, I have been waiting for this, but what I really want to be able to do is to publish the chart to my Google personalised page and have it autoupdate.
ReplyDeleteIt's a pity that does not export embedded chart to odf or xls.
ReplyDeleteYou're right, Amondó. Google Spreadsheets doesn't include the charts when you export the spreadsheet and it doesn't import the charts from xls or ods files. So the support for charts is really basic.
ReplyDeleteIf you need more advanced charts (outside the Google spreadsheet as images), you can also use the free online charting service:
ReplyDeletewww.chartAll.com
Charts can be created from manually typed data, Google spreadsheets, data linked from url, etc.
Includes basic charts, XY charts, XYZ 3D charts, Gauges, Geographical (mapping / GIS) charts, financial OHLC, and much more.
regards
david
www.chartAll.com
Jayant and others - you can publish your chart as you would publish any other sheet or range...
ReplyDeletejust use the "PUBLISH" tab - go to "More Publishing Options" and choose the "HTML to Embed in a web page" format... That will give you iFrame code to embed in you page/blog...
Use the undocumented &gidlines=false to turn off those grid lines...
This will auto opdate ifyou chose that option on the main 'publish' tab.
What about SVG support for WebKit?
ReplyDeletems excel 2007 is way better
ReplyDelete